


Who wants to teach anyways?
And why are California and Florida so similar on key K-12 data points?

What’s going in the market
ACT scores are the lowest they’ve been since 1991. 4 in 10 seniors don’t meet college readiness scores. College enrollment has declined for 3 years in a row (although it seems to be plateauing this year), meanwhile, which will lead to reduced requirements and/or eliminate testing entirely.
Lower enrollment also has implications for downstream players. Cengage’s print sales were down 40% last year and Chegg’s revenue is down 7% YoY. It’ll be interesting to see how this unfolds for other ecosystem players, like LMS’s (Blackboard), transfer articulators, and transcript providers (like Parchment).
Yes but…While longterm college enrollment declined 15% between 2010 to 2021, college applications for 2023-2024 have increased 30% over 2019-2021 (Source: Forbes). There are signs that the decline is cooling. This is driven by a massive surge in international applicants (which increased 55% vs domestic applications’ 18% increase), concern over AI, and fears of the recession. The Great Recession caused a steep increase in college enrollment, and now’s a perfect time to find a good reason to go back to school (if you can afford it).
This week, we take a look at the teacher pipeline. Specifically, we try and figure out why some states have really high teacher to student ratios (a proxy for pipeline). And why do Florida and California—such polar opposites in a lot of ways—have such similar teacher to student ratios and similar national assessment scores.
Who Wants to be a Teacher These Days Anyways?
There are a lot of scary signs out there signaling a long-term drought for our teacher pipeline.
Teach for America placed its smallest cohort since 2008, and half as many Corps Members as 2019 (Source: EdWeek).
In 1970, Education degrees were the most popular degree, with 176,307 degrees conferred, or 21% of all degrees (Source: US DOE)
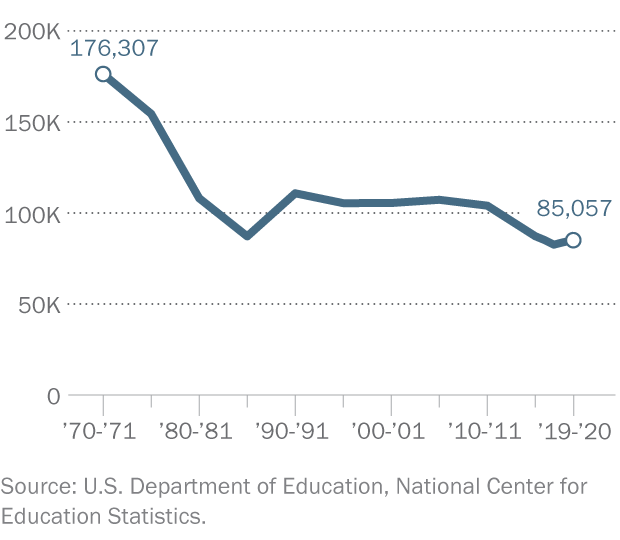
In 2020, there were about 85K education degrees. In 1970, 36% of women’s degrees were in education. Now, they make up about 6%.
Question: How likely are you to encourage your child or another young person you know to become a K-12 Teacher?
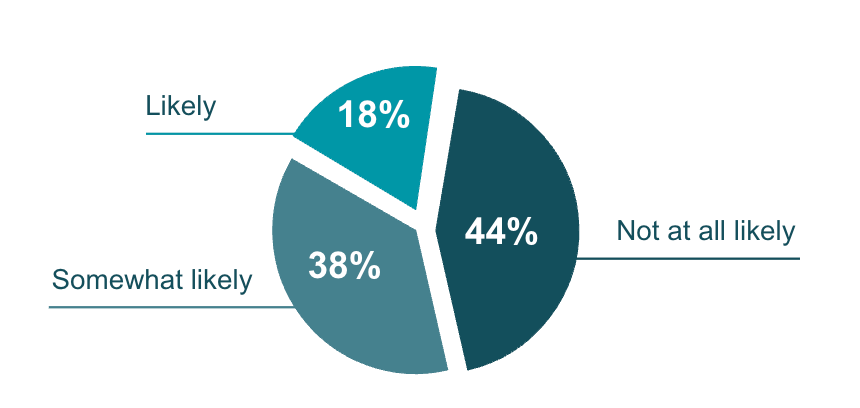
Nearly half (44%) of American adults would advise a young adult against becoming a teacher (source: NORC Research, University of Chicago). 92% of respondents cited low pay as a barrier (and 69% cited it as a major barrier). We’ve talked before about this, but adjusting for inflation, teacher salaries have declined by 6.4% over the past decade (source: NEA)—or about $3.6K.
Fewer young people are becoming teachers. On the other hand, the share of older people in the profession is increasing. Teachers aged 60+ made up 3% of all teachers in 2000. Now, they make up 7%. These educators will retire soon.
And who’s going to take their place? Fewer young people are getting teaching degrees and there are fewer alternative pipelines (like TFA).
Implications for Schools and Districts
Applications for open positions has dwindled from double- and triple-digits to single digits or none. 40% of schools with a 75% minority populations are reporting multiple vacancies.
There aren’t enough qualified teachers and fewer people are entering the profession. Teachers are quitting earlier in their career for other fields, and a higher proportion of teachers are approaching retirement age than in the past. Meanwhile, strict certification requirements are limiting who can fill vacancies. This negatively impacts the teacher to student ratio.
Number of Teachers per 1,000 Students

Source: Data from Scholaroo
Some states, like Wymong (78 teachers per 1,000 students), are drastically different from their contiguous neighbors (Utah has 44 per 1,000). West Virginia has 73 per 1000, while Ohio has 56 per 1,000 and Kentucky has 61 per 1,000.
Teachers are already moving within districts. In Michigan (59 per 1,000), 60% of administrators cite teacher poaching as an issue. But teachers won’t really move state-to-state as often—at least not pre-COVID. Teachers are 45% less likely to move to another state than their college-educated peers, but only 5% less likely to move long-distance within the state (Source: National Bureau for Economic Research).
So then what explains why some states have nearly 100 teachers per 1,000 students (10:1), and others languish with 40 teachers per 1,000 students (25:1).
Teacher Vacancies per 1,000 Students
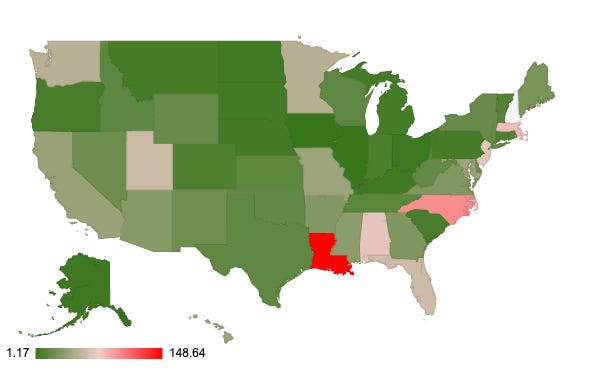
Source: Teacher Shortages, Researchers from Brown University
How do some states have such divergent paths to the same results?
Why is it that California and Florida—two of the most politically polar states, with two drastically different funding amounts per student and teacher salaries—are so similar on NAEP scores and teacher to student ratio.
California:
Teachers per 1,000 enrolled students: 46
Teacher Pay Gap: 81% (Source: NEA)
Per Student Spend: $16K per student (Source: NEA)
Median Teacher Salary: $88K (Source: NEA)
Teacher vacancies per 1K students: 38
8th Grade NAEP Scores: Reading - 259; Math - 270 (Source: NAEP)
Florida:
Teachers per 1,000 enrolled students: 50
Teacher Pay Gap: 80%
Per Student Spend: $11K per student
Median Teacher Salary: $51K
Teacher vacancies per 1K students: 59
8th Grade NAEP Scores: Reading - 260; Math - 271
California and Florida may be very different on a few measures, but they have really similar teacher : student ratios, two of the closest NAEP results, and two of the closest teacher pay gap ratios (the gap between teacher salary and college educated peers with the same years of experience) of any two states.
What lead to higher academic achievement?
I looked at teacher to student ratios because it was a proxy for the teacher shortage. Now I wanted to see if that ratio—along with other data points—actually correlates to higher academic achievement.
Note: Teacher vacancies was a bit more tough to look at, since the postings aren’t necessarily indicative of a shortage. New Hampshire has 97 teachers per 1,000 students, one of the highest teacher : student ratios in the US, but they also had the highest teacher vacancies per 1,000 students—by a multiple of 2x 2nd place: 349 vacancies per 10,000 students (Louisiana, in 2nd place, had 149 vacancies, but has a very solid 70 teachers per 1,000 student ratio).
How to increase test scores / academic results
I looked at 8th Grade Reading scores as a proxy for academic achievement. Teacher Pay Gaps, Teacher to Student ratios, the cost of living affordability—all of those have weak positive correlations. But Median Teacher Salary and Per Student Spend had the highest correlations of 0.45 and 0.37 respectively (about 2x the other variables). Teacher to Student ratio did have the strongest correlation coefficient (0.236, so weak positive) for 8th Grade Math scores—pulling slightly ahead of Teacher Salary and Per Student Spend.
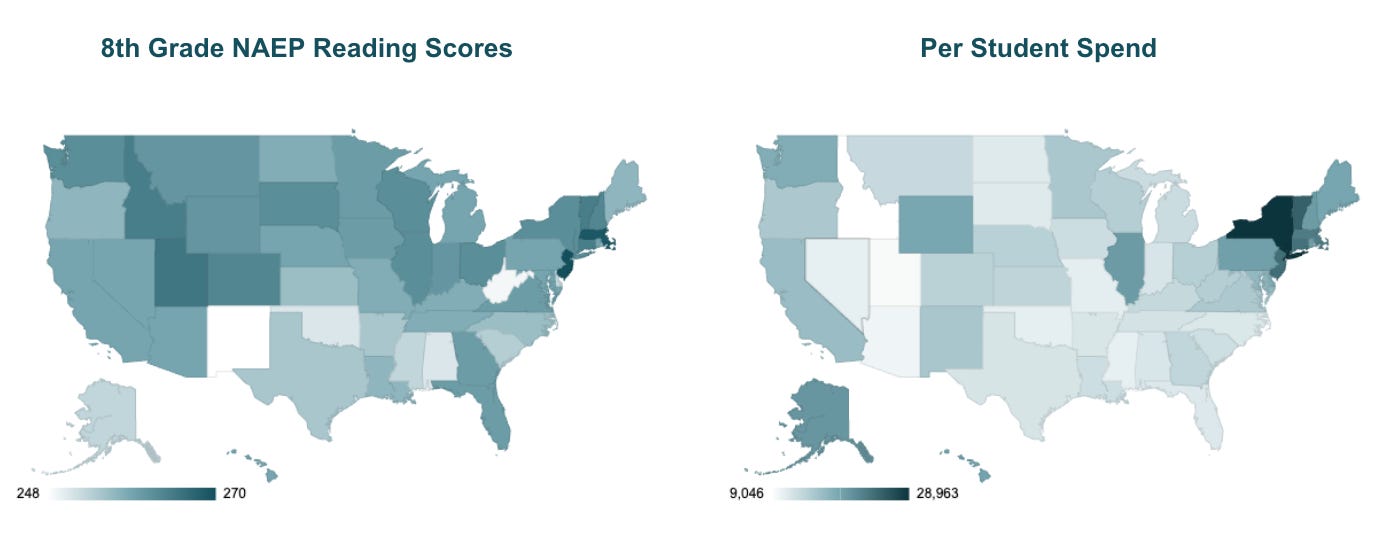
This isn’t to say that Teacher Salaries and Per Student Spend are magic bullets. There are outliers. New York’s 8th Grade NAEP scores are respectable (top 15 for Reading, top 25 for Math), but it’s 40th for 4th Grade Reading. The state tops Per Student Spend at $28K, about 3X Idaho and Utah, which had higher scores than NY in each 4th and 8th grade test.
But generally, if you want good results, you pay teachers more and spend more on students.
You can see the data I compiled here.
How to expand teacher pipelines:
So we know what impacts test scores. But what impacts teacher pipeline? How can we achieve higher Teacher : to Student ratios? Especially since it’s not a demand issue—there are TONS of vacancies out there.
Funnily enough, Teacher Starting Salary and Median Teacher Salary had negligible correlation coefficient values with Teacher : Student ratios.
However, one positive coefficient was Teacher Pay Gap—a measure of how much a teacher makes relative to a college educated peer with similar work experience (ρ = 0.3).
When teachers don’t have as large of an opportunity cost for pursuing the profession, there are more teachers per student. A teacher might have low absolute salaries (North & South Dakota, Minnesota, Wyoming), but if they have low pay gaps, then there are higher teacher ratios. This makes sense.
But the strongest correlation to Teacher : Student ratio, by far—and this was really surprising—is per student spend and the teacher : student ratio (ρ = 0.54). When states spend more per student, even if the teacher pay gap is wide, or teacher salaries are low, there are more teachers per student.
More Per Student Spend, More Teachers?!

New Hampshire has the second highest ratio of teachers to student and the highest per student spend, despite a wide wage gaps (71%). They spend $19K per student and have 97 teachers per 1,000 students.
NY, NJ, Connecticut, Vermont, and MA have the top 5 highest student spend and rank: 4, 7, 9, 1, and 8 restively for Teacher : Student ratios, with Vermont sitting pretty at 97.6 teachers per 1K students (Vermont also has one of the lowest wage gaps—their teachers make 87% of their peers’ salary).
On the other hand, Idaho, Utah, Arizona, Nevada, Mississippi and Oklahoma are the only 6 states to spend less than $11K per student (the average is $15.3K). Arizona, Utah, and Nevada rank 48th, 49th, and 50th for Teacher : Student ratios. Idaho is 44th, Oklahoma is 38th, and Mississippi bucks the trend at 19th. Florida spends $11K per student and is 46th for teacher : student ratio. Alabama spends $11.8K and is 45th for teacher : student ratios. Despite having abysmal student spend and Teacher : Student ratios and a high wage gap, Utah absolutely crushes state assessments and I have no way to explain this. I’m sure demographics play into this an LEA analysis might be needed.
The Takeaways
You want good student achievement? Pay teachers more. You’ll get higher quality educators and higher retention.
You want teachers in your schools? Help your students. Give them the resources they need by spending more.
This checks out with my own experiences and the conversations I’ve had with fellow teachers. When your school is well-funded, you have school counselors and therapists. You can go on field trips. You have good technology, high quality curriculum, PD, and more supplies. There’s an IEP team to push-in. You feel supported.
I think this is sort of self-evident, when you think about it. It’s the same reason people care about benefit packages, and growth opportunities, and good company culture. Yes, extrinsic motivation is important, but teachers go into this field knowing they’re going to take a haircut on pay. But they enter this field in spite of that because they want to be a part of something bigger than themselves.
This was fun. I pasted different raw data in a Google Sheet here. One day I’ll add those measures over time to get more accurate correlation coefficients for NAEP scores.